Anomaly Detection in Multivariate, Unsupervised Time-series Data

Background
Our customer manufactures PCBs and collects unsupervised, time-series data concerning various test measurements on each unit in production.
By using the Vanti platform, they were able to put that data to use- they built multivariate, anomaly detection models that successfully identified faulty units that needed to be scrapped or reworked before further processing. They were also able to use Vanti’s solutions to find patterns, and are now able to continuously monitor changes/drifts in production.

Objectives
- What are the anomalies?
- Multivariable Anomaly detection: find outliers in each column/columns
- What are the patterns?
- How do the patterns change/drift?
- For the tests with a pattern, -> find the change in the pattern. Where is the drift?
Data
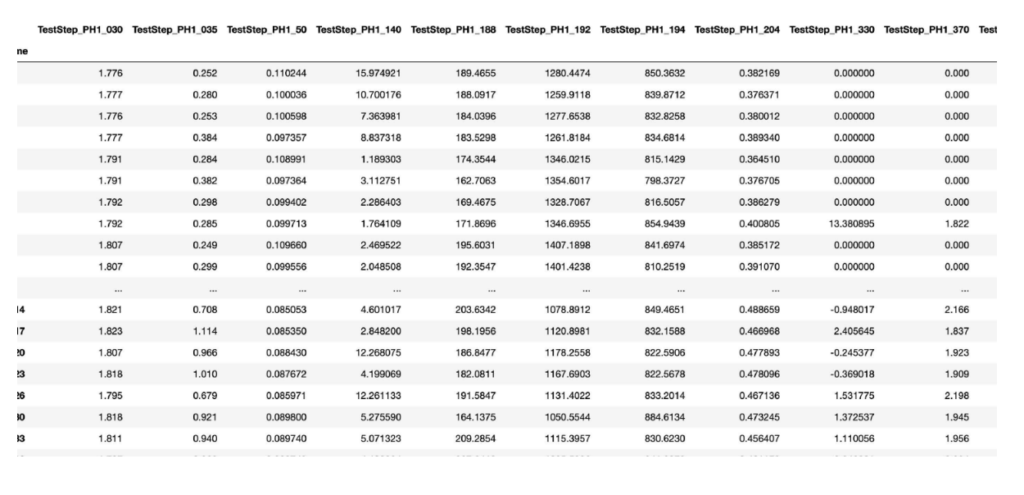
- Columns in the data represent different tests on the PCBs (voltage/current/frequency)
- Rows are the test results- every 3 minutes
- The typical anomaly range is 7%-8%
Methodology
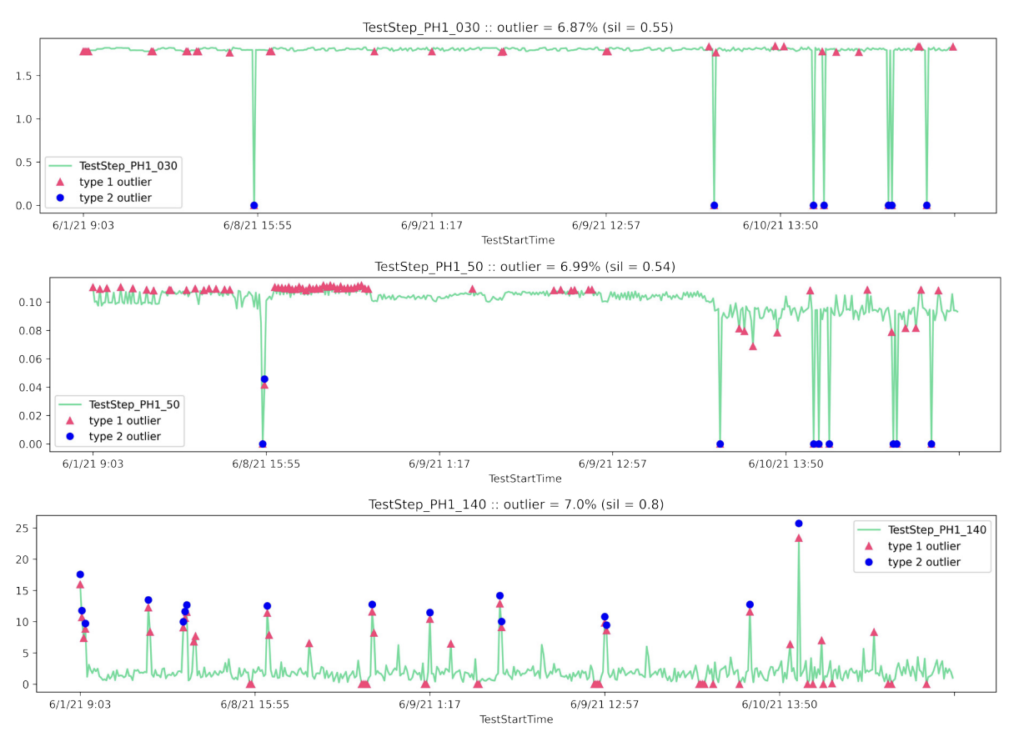
- green - raw measurements
- pink - outliers, when there's a drift you'll see a section with pink markers
Conclusion
PCBs are expensive to produce, identifying anomalies early in the process has a major
impact on the bottom line:
- Material Savings
- Energy Savings
When you are able to use AI to process data to identify defects and the most important metrics, test results, and patterns in your production line, you are able to make improvements to reach your KPIs in ways that your competition does not, yet. This also impacts your bottom line in ways that are harder to quantify, but are easy to understand:
- Increase throughput
- First pass yield
- Improved supply reliability
- Lower production costs = more competitive pricing = Larger market opportunity
If you can use time-series data to better understand your production, you have the potential to minimize downtime. There is less time wasted on root cause analysis, as it is done in real-time, without a need to shut down your production. When you use AI to diagnose an issue, you have data-driven confidence that you know what the problem is, and can get to the root cause sooner.
Results
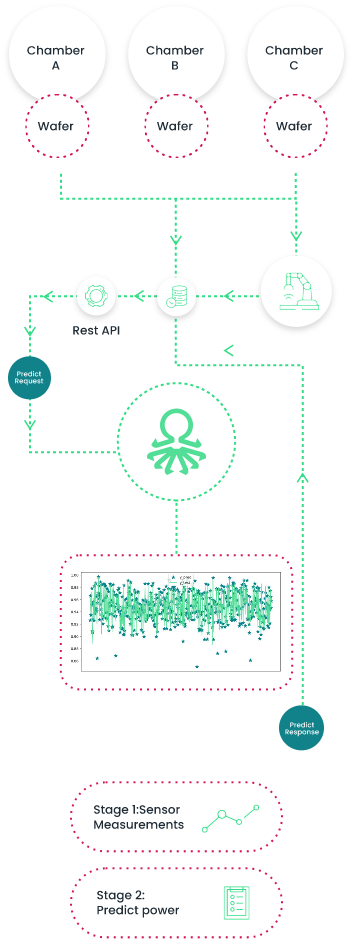
An unsupervised model that can detect anomalies and patterns in time-series data to be able to scrap or rework units before they are further processed Closed-loop solution: Customer provides real-time data to Vanti through API; Vanti identifies outliers and drifts in real-time Production adjustments impacts are measured and understood immediately, enabling true continuous improvement, process optimization.


