Multi-defect detection during manufacturing processes is a vital step to ensure product quality.
The timely detection of faults or defects and taking appropriate actions are essential to reduce operational and quality-related costs.
According to Aberdeen’s research, “Many organizations will have true quality-related costs as high as 15 to 20 percent of sales revenue.”
Despite the importance, it’s challenging to do when you have unsupervised data. With manual inspection processes usually being long and costly, it is clear why manufacturers are looking to leverage new technologies such as AI/ML to automate these tasks.
In this study, we show why it’s necessary to develop and implement smart algorithms to detect the anomalies and defects, even when the training data is not ideal.
Goal
In this study, we wanted to identify an unknown number of defects, regardless of shape and size.
Each image in the set may contain any number of defects from 0 to some N, of any shape or size.
Data
The data set contains 6,633 images.
~50% are good
~50% contain any number of defects.
(The images are not aligned in terms of focus, zoom, rotations, transitions, or keystone.)
Challenges
- The number of defects per image is unknown.
- Defect types can be very rare
- Small dataset size
(potentially)
Algorithim
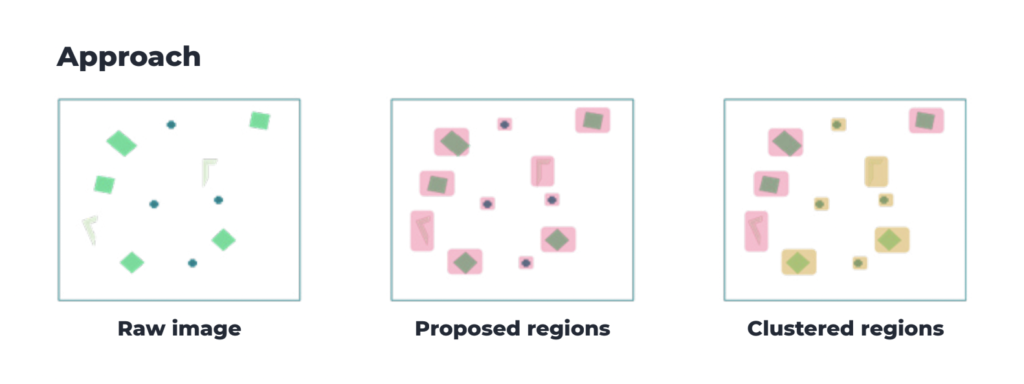
Step 1 – get regions
Using data from step 1, you can then classify based on whether it contains a defect or not.
*This is done without labels – unsupervised.
Step 2 – classify each region
Per region from step-1 and classify if it contains a defect.
This is done without labels – unsupervised.
Step 3 – run Vanti clustering algorithm per region
Per proposed region, which is deemed to contain a defect with high probability, the Vanti algorithm for image defect detection is run to establish the defect location and type (i.e., cluster).
Step 4 – iterate steps 1-3 till some threshold is reached.
Algorithm deep dive - Vanti’s IP
Results
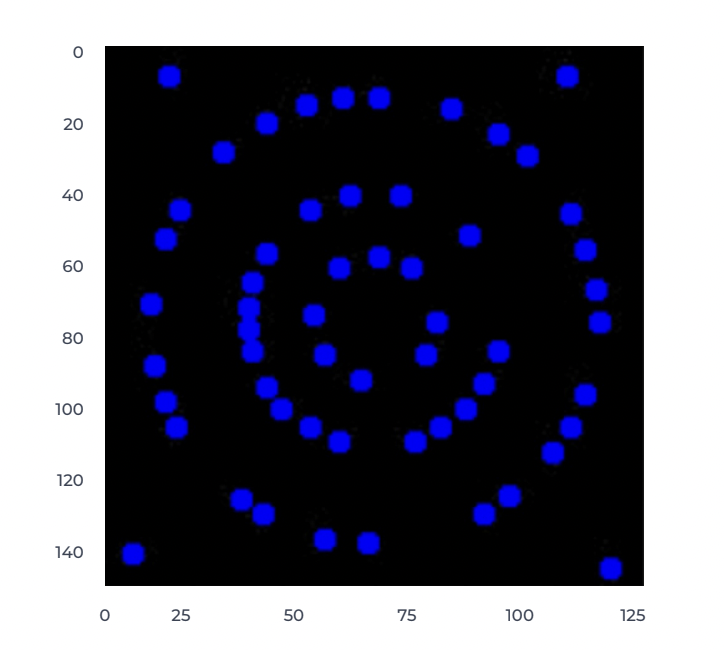
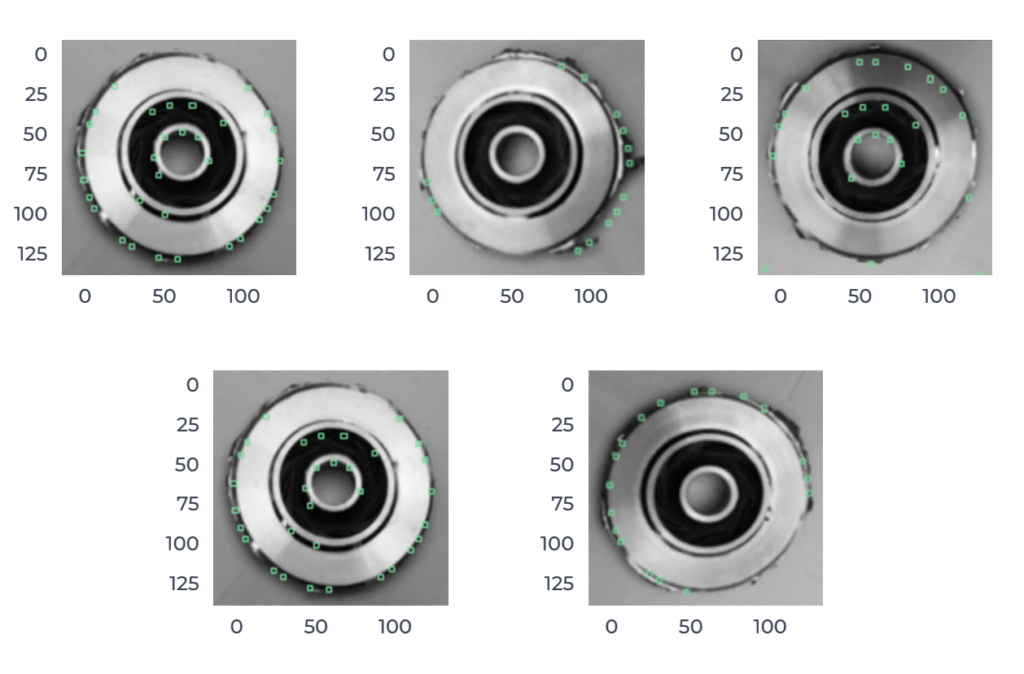
1. Finding unknown N defects
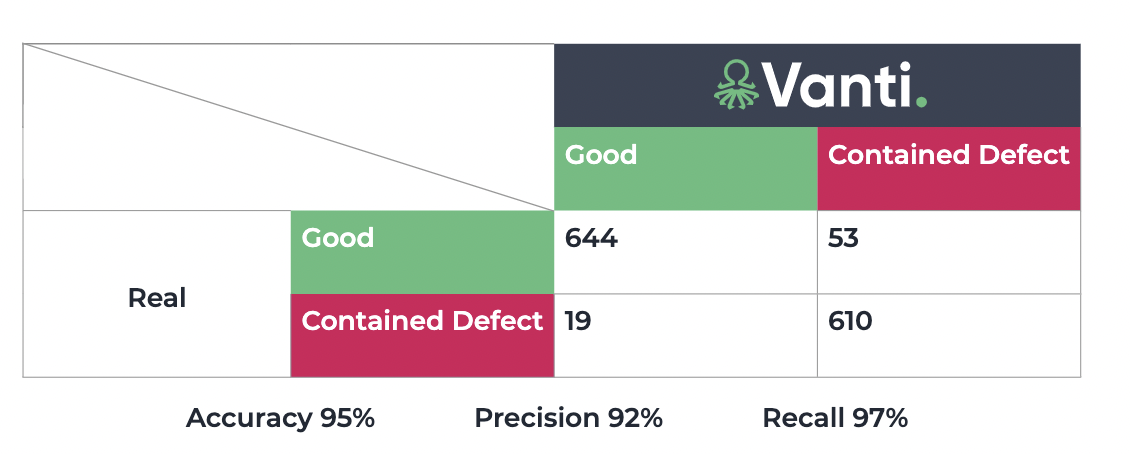
2. Defect detection in images with N>0 defects
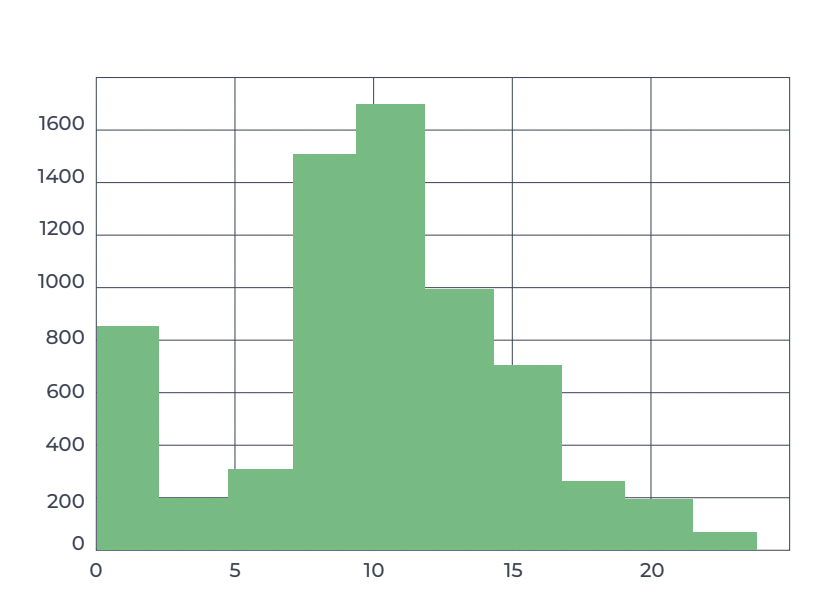
a. Average defects = 9
b. Max defects = 23 Defect histogram:
3. Run time Vs. N vs. #of images
a. 6,663 images were processed in 21 minutes on an M1chip Apple McBookPro.
b. The run time is linear in N (total defects per image)
c. The run time is linear in the total number of images.
Visuals
Conclusion
1. The proposed method can provide an excellent defect detection capability, that’s able to identify, mark, and cluster defects in unlabeled images.
2. The proposed method can process large amounts of images quickly.
3. This approach can be the base for identifying anomalies in manufacturing lines, where multiple defects can be present in the same image/video file.
